

Use irregular acquisition to compensate for irregular access, costs, and noise.
Ideas and benefits
Does your survey design ensure that the data you collect will provide the quality needed to meet your goals? We can optimize source and receiver geometry for strong noise and/or uneven noise and access across a survey. The goal is to produce uniform noise-corrected fold at the lowest cost.
This process is described in more detail in the January 2023 First Break article: Using ‘Noise-Corrected OVT Fold’ to optimise land seismic acquisition risk, costs, and quality
In our processing work, we often see ten fold variation in noise and much irregularity caused by access constraints. Some parts of a survey will be overshot, and some are undershot creating noise holes. Note that the value of a traces goes by the square if its signal to noise ratio. A trace with 10 times more noise contributes 100 times less to the final image.
Optimizing source and receiver geometry to take into account varying access and noise is a large, demanding inversion problem. We have the computers and expertise with inversion algorithms to perform this optimization.
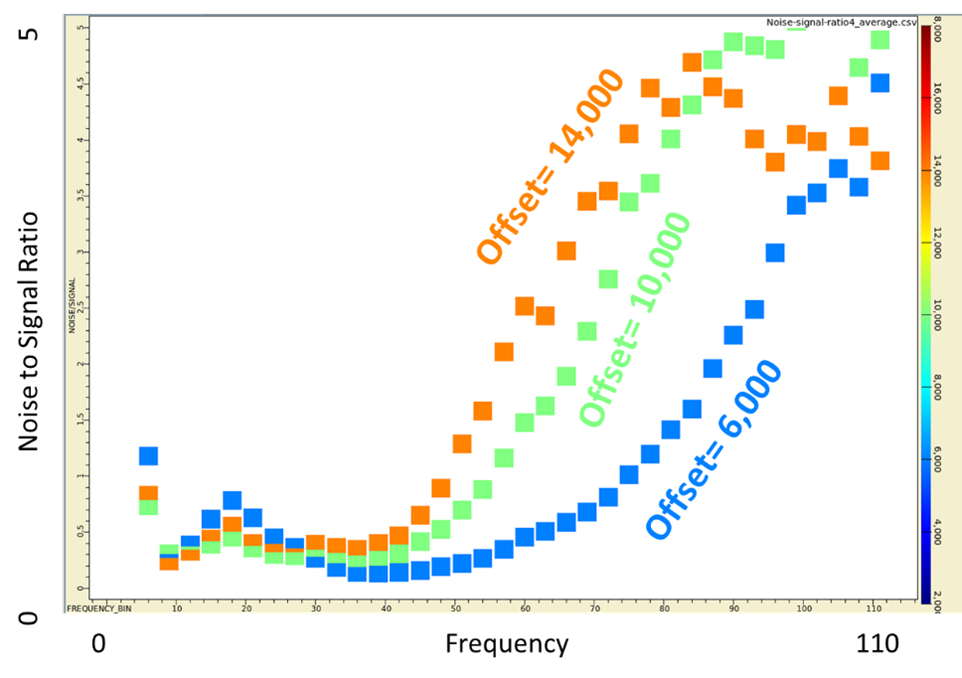
Data quality varies signifcantly with frequency and offset
survey planning
Acquisition Optimization
Using our global optimization process and software, NOLA, we can perform global and local optimization of survey design. The optimization process takes into account the ideal survey layout, imaging goals, access and cost constraints, noise characterization and noise maps. These factors are irregular and your acquisition should take advantage of this. We will provide preliminary results and later refine these based on customer feedback. Multiple scenarios for layout can also be recommended. Three typical scenarios could be:
1. Optimization for acquisition and imaging only, not taking into account noise maps (baseline)
2. Optimization accounting for noise without adding any source/receiver locations
3. Optimization accounting for noise adding up to 10% more source and receiver locations
These can be modified or added to if desired and this methodology can save 10-60% on acquisition costs while giving confidence that the seismic data you acquire will meet your imaging goals.
Steps in Noise Analysis and Survey Optimization
Phase I – Analyze existing data and design field test
Phase II – Analyze and process field test, make recommendations for regular 3D acquisition
Phase III – Use the results of Phases I and II in combination with satellite data and LIDAR to recommend acquisition enhancements
You Provide Us With the Following:
GIS or grid maps of access constraints for sources and receivers. This can be no-permit areas, topography, exclusion boundaries around structures, etc.
GIS or grid maps of costs of placing sources and receivers in different locations. This can be where vibes can access, where heli-support is necessary, where foot access is difficult, etc.
GIS or grid maps of roads and other cultural noise generators. Roads and industry can cause a lot of noise.
Nearby legacy data that can be used for prestack noise analysis.
Maps of surface geology that you can expect to influence noise. Noisy areas may be thick, unconsolidated sediments, very shallow water table, sand dunes. Good areas may be agricultural fields, shallow bedrock, homogeneous near surface.
